
Development of an Improved Drinking Water Quality Monitoring Scheme using Wireless Sensors
- Post by: airjournals
- May 27, 2023
- Comments off
1Odedina, Kayode S., 2 Onoh, Gregory N.
1Open Distance and e-Learning, National Universities Commission, Abuja, Nigeria
2Department of Electrical and Electronic Engineering, Enugu State University of Science and Technology, Nigeria
Citation -APA
Odedina, K. S. & Onoh, G. N. (2023). Development of an Improved Drinking Water Quality Monitoring Scheme using Wireless Sensors. Journal of Computer Science Review and Engineering, 7(1) 1-11. DOI: https://doi.org/10.5281/zenodo.7976540 | FULL PDF
ABSTRACT
Consuming contaminated water can easily lead to various diseases. To prevent health hazards associated with unsafe water, it is crucial to have a more efficient and dependable method for detecting any unfavorable changes in the color, smell, temperature, humidity, pH, and turbidity of water intended for human consumption. To this end, an improved wireless sensor network was developed for monitoring drinking water quality. The system employed an agricultural sensor board equipped with a temperature sensor, which is a vital parameter for assessing water purity. The Waspmote wireless sensor, initially designed to measure leaf wetness, was adapted for measuring and monitoring water temperature as an early warning system. The results obtained from testing the system at varying distances between the water source and the equipment over a period of 10 days showed that the Waspmote wireless sensor accurately detected even slight differences in water conditions. The software used in the experiment showed an average water temperature of 25.57ºC, which remained relatively constant throughout the study. Any changes in the environment affecting the sampled water were quickly detected by the system, including slight increases in water temperature, which could indicate impurities in real-world water supply chains. When the water was pure, the average temperature reading closely resembled individual temperature readings in the environment. Thus, the system has the ability to keep a continuously strict check on threats to water pollution as well as ensure an environment friendly water source.
Keywords: Improved Drinking Water Quality Monitoring Scheme; Waspmote Wireless Sensor; Temperature Sensor; Agricultural Sensor Board
Introduction
Water is needed for chemical and biochemical activities in the body of humans. The possible contaminations that drinking water can get are physical contaminations such as suspended solids, odour and taste, Chemical contamination involving mineral and organic substances, and Bacteriological contamination involving the presence of bacteria and fecal pollution. Consumption of contaminated or impure water can be dangerous to the overall functioning of the body chemistry of an individual. Temperature, humidity, pH, turbidity, Smell and color are the parameters measured in the water meant for drinking. Some authors have done research works that were aimed at finding a solution to the problem of contaminated water. Wang et al examined a wireless water quality monitoring method that can continuously monitor three water quality parameters: water temperature, PH value, and turbidity (Wang et al 2021). The water quality monitoring method is mainly based on the extended circuit of the STM32 series single-chip microcomputer, including the pH sensor control circuit module, temperature sensor circuit module, wireless network communication circuit module, turbidity sensor circuit module, etc. Based on the C language to write the MCU data acquisition program and the PC program developed on the virtual instrument design language platform, data analysis and processing, process monitoring and other subroutines were done. The water quality monitoring method can detect different water quality in real-time through wireless transmission.
Adu-Manu et al., (2017) proposed Smart River monitoring using a wireless sensor network in Greater Accra. Smart water sensors and smart water ion sensor devices from Labellum were deployed at the intake to measure physical and chemical parameters (Adu-Manu et al 2017). The sensed data obtained at the central repository revealed a pH value of 7. Conductivity levels rose from 196 S/cm to 225 S/cm. Calcium levels rose to about 3.5 mg/L and dropped to about 0.16 mg/L. The temperature of the river was mainly around 35°C to 36°C. Fluoride levels between 1.24 mg/L and 1.9 mg/L were observed and the oxygen content rose from the negative dissolved oxygen (DO) to reach 8 mg/L. These results showed a significant effect on plant and aquatic life. Wireless sensor networks offer a promising infrastructure for municipal water quality monitoring and surveillance. This is because their greatest value comes from affordability and the ability to conduct measurements remotely and in real time. However, these networks have resource limitations in terms of processing power, memory, communication bandwidth and energy/power and if not averted, can hinder the effectiveness and efficiency of employing wireless sensor networks. Hence this work will adopt an automatic and seamless testing system that will continuously monitor the quality of water using the principles of the wireless sensor network.
Theory
Wireless Sensor Network
Wireless Sensor Network (WSN) is a network of Radio Frequency (RF) transceivers, sensors, machine controllers, microcontrollers, and user interface devices with at least two nodes communicating using wireless transmissions. A wireless sensor network is a group of specialized transducers with a communications infrastructure for monitoring and recording conditions at diverse locations (Antoine, & Marco, 2011). Typically, a wireless sensor network contains hundreds of thousands of sensor nodes. The sensor nodes which are small, lightweight and portable can communicate among themselves using radio signals. A wireless sensor node is equipped with sensing and computing devices, radio transceivers and power components. The individual nodes in a wireless sensor network (WSN) are inherently resource-constrained: they have limited processing speed, storage capacity, and communication bandwidth. After the sensor nodes are deployed, they are responsible for self-organizing an appropriate network infrastructure often with multi-hop communication with them. Then the onboard sensors start collecting information of interest. Wireless sensor devices also respond to queries sent from a “control site” to perform specific instructions or provide sensing samples. The working mode of the sensor nodes may be either continuous or event-driven (Pule, et al 2017).
The microcomputer processes and stores the sensor output. The transceiver receives commands from a central computer and transmits data to that computer. The power for each sensor node is derived from a battery. TinyOS was considered the first operating system specifically designed for wireless sensor networks. It was an operating system based on an event-driven programming model instead of multithreading (Akkaya 2015). TinyOS programs are composed of event handlers and tasks with run-to-completion semantics. However, LiteOS is a newly developed operating system for wireless sensor networks, which provides UNIX-like abstraction and support for the C programming language (Forster 2018).
Water Testing Procedures
Generally, water testing is done in three categories; physical, chemical and bacteriological.
Physical Test
The Waspmote wireless sensor was installed in accordance with the manufacturer’s instructions and connected to a laptop with the appropriate software. Prior to taking measurements, the sensor was calibrated to ensure accuracy. A water sample was collected from the source being tested and placed in a clean, sterilized container. The Waspmote sensor was then inserted into the water sample to measure temperature, humidity, pH, and turbidity levels, with the results being recorded automatically and maintained by the software or data sheet. The recorded measurements were compared to standard values to determine if the water sample met the necessary safety requirements. In addition to the above, the Agric. Sensor Board was set up and the Temperature Sensor was installed on it (Pule, et al 2017). The Waspmote Software and Compiler (API or SDK) were installed on the laptop. The temperature sensor was powered on and the real-time data output was verified, after which a simple C++ application was written to read the data. A Leaf Wetness Sensor Reading was taken, and the setup was tested for ten consecutive days at 6:30 a.m. to confirm the real-time data readings. To achieve the ambient temperature required, the Agric. Board with the installed temperature sensor was placed in a container filled with tap water and the parameters on the Waspmote Software were reconfigured. It was verified that the real-time temperature reading displayed on the laptop was correct. The specific physical water testing procedures may vary depending on the type of water being tested and the purpose of the test (Ahmed et al 2020).
Chemical Test
Chemical tests encompass pH, hardness, the presence of a selected group of chemical parameters, biocides, highly toxic chemicals, and the Biological Oxygen Demand (B.O.D) that may be found in a given water sample. In a water sample, pH can be explained as a measure of hydrogen ion concentration. It is an indicator of the relative acidity or alkalinity of that water. Values of 9.5 and above indicate high alkalinity while values of 3 and below indicates acidity (Ahmed et al 2020). Low pH values help in effective chlorination but cause problems with corrosion. Values below 4 generally do not support living organisms in the marine environment. Drinking water should have a pH between 6.5 and 8.5. Harbour basin water can have a pH variation of between 6 and 9. B.O.D. is used to denote the amount of oxygen needed by microorganisms for the stabilization of decomposable organic matter under aerobic conditions. When B.O.D. is high, it is an indication that there is less oxygen to support life and it indicates organic pollution in the water (Pule, et al 2017).
Bacteriological Test
In this aspect of water testing, it will be good to state that for technical and economic reasons, analytical procedures for the detection of harmful organisms are impractical for routine water quality surveillance. It must be appreciated that all that bacteriological analysis can prove is that, at the time of examination, contamination or bacteria indicative of fecal pollution, could or could not be demonstrated in a given sample of water using specified culture methods. In addition, the results of the routine bacteriological examination must always be interpreted in the light of a thorough knowledge of the water supplies, including their source, treatment, and distribution (Pule, et al 2017). Whenever changes in conditions lead to deterioration in the quality of the water supplied, or even if they should suggest an increased possibility of contamination, the frequency of bacteriological examination should be increased, so that a series of samples from well-chosen locations may identify the hazard and allow remedial action to be taken. Whenever a sanitary survey, including visual inspection, indicates that a water supply is subject to pollution, remedial action must be taken, irrespective of the results of the bacteriological examination. For unpiped rural supplies, sanitary surveys may often be the only form of examination that can be undertaken regularly. The recognition that microbial infections can be water-borne has led to the development of methods for routine examination to ensure that water intended for human consumption is free from excremental pollution. Although it is now possible to detect the presence of many pathogens in water, the methods of isolation and enumeration are often complex and time-consuming. It is therefore impractical to monitor drinking water for every possible microbial pathogen that might occur with contamination (Ahmed et al 2020).
A more logical approach is the detection of organisms normally present in the faeces of man and other warm-blooded animals as indicators of excremental pollution, as well as of the efficacy of water treatment and disinfection. The presence of such organisms indicates the presence of faecal material and thus intestinal pathogens. (The intestinal tract of man contains countless rod-shaped bacteria known as coliform organisms and each person discharges from 100 to 400 billion coliform organisms per day in addition to other kinds of bacteria). Conversely, the absence of faecal commensal organisms indicates that pathogens are probably also absent. Search for such indicators of faecal pollution thus provides a means of quality control (Tuna, et al 2014). The use of normal intestinal organisms as indicators of faecal pollution rather than the pathogens themselves is a universally accepted principle for monitoring and assessing the microbial safety of water supplies. Ideally, the finding of such indicator bacteria should denote the possible presence of all relevant pathogens.
Acceptable or Tolerable Substances Level in Water
The European Union (EU) and World Health Organization (WHO) are in the lead for standards acceptable for potable water. Table 1 shows the W.H.O. drinking water standards and Table 2 shows the EU estuary and harbour basin water standards (Fawell 2007).
Table 1: W.H.O. Drinking Water Standards
| PARAMETER | UNIT | LIMIT |
| Aluminium | mg Al/l | 0.2 |
| Arsenic | mg As/l | 0.05 |
| Barium | mg Ba/l | 0.05 |
| Berylium | ug Be/l | 0.2 |
| Cadmium | ug Cd/l | 5.0 |
| Calcium | mg Ca/l | 200.0 |
| Chromium | mg Cr/l | 0.05 |
| Copper | mg Cu/l | 1.0 |
| Iron Total | mg Fe/l | 0.3 |
| Lead | mg Pb/l | 0.01 |
| Magnesium | mg Mg/l | 150.0 |
| Manganese | mg Mn/l | 0.1 |
| Mercury | ug Hg/l | 1.0 |
| Selenium | mg Se/l | 0.01 |
| Sodium | mg Na/l | 200.0 |
| Zinc | mg Zn/l | 5.0 |
| Chlorides | mg Cl/l | 250.0 |
| Cyanide | mg Cn/l | 0.1 |
| Fluorides | mg F/l | 1.5 |
| Nitrates | mg NO3/l | 10.0 |
| Nitrites | mg NO2/l | – |
| Sulphates | mg SO4/l | 400.0 |
| Suphides | mg H2S/l | 0 |
| TOTAL “drins” | ug/l | 0.03 |
| TOTAL “ddt” | ug/l | 1.0 |
| Hydrocarbons | mg/l | 0.1 |
| Anionic Detergents | mg/l | 0 |
| pH | 9.2 | |
| Total dissolved solids | mg/l | 1500 |
| Total hardness | mg/l | 500 |
| Alkalinity | mg/l | 500 |
| MICROBIOLOGICAL PARAMETERS | ||
| Total Bacteria | Count/ml | 100 |
| Coliform | Count/100ml | 0 |
| E. Coli | Count/100ml | 0 |
| Salmonella | Count/100ml | 0 |
Table 2: EU estuary and harbour basin water standards
| PARAMETER | UNIT | LIMIT |
| Mercury | ug Hg/l | 0.50 (D) |
| Cadmium | ug Cd/l | 5.00 (D) |
| Arsenic | mg As/l | 0.50 (G) |
| Chromium | mg Cr/l | 0.50 (G) |
| Copper | mg Cu/l | 0.50 (G) |
| Iron | mg Fe/l | 3.00 (G) |
| Lead | mg Pb/l | 0.50 (G) |
| Nickel | mg Ni/l | 0.50 (G) |
| Zinc | mg Zn/l | 50.00 (G) |
| Tributyltin | ug/l | 0.002 |
| Triphenyltin | ug/l | 0.008 |
| Aldrin | ug/l | 0.01 |
| Dieldrin | ug/l | 0.01 |
| Endrin | ug/l | 0.005 |
| Isodrin | ug/l | 0.005 |
| TOTAL “drins” | ug/l | 0.03 |
| TOTAL “ddt” all 4 isomers | ug/l | 0.025 |
| para-ddt | ug/l | 0.01 |
| Hexachloro-cyclohexane | ug/l | 0.02 |
| Carbon tetrachloride | ug/l | 12.0 |
| Pentachlorophenol | ug/l | 2.0 |
| Hexachlorobenzene | ug/l | 0.03 |
| Hexachlorobutadiene | ug/l | 0.10 |
| Chloroform | ug/l | 12.0 |
| Ethylene Dichloride | ug/l | 10.0 |
| Perchloroethylene | ug/l | 10.0 |
| Trichlorobenzene | ug/l | 0.40 |
| Trichloroethylene | ug/l | 10.0 |
| Hydrocarbons | ug/l | 300.0 (G) |
| Phenols | ug/l | 50.0 |
| Surfactants | ug/l | 300.0 (G) |
| Dissolved Oxygen | % Saturation | 80-120 (G) |
| pH | 6-9 | |
| Sulphide | mg/l | 0.04 (S) |
| MICROBIOLOGICAL PARAMETERS | ||
| Faecal conforms | per 100ml | 2000 |
| Total coliforms | per 100ml | 10000 |
| Salmonella | 0 | |
| Entero viruses | 0 |
Materials and Methods
The Agricultural sensor board contains special sensors for temperature, humidity and air. The Temperature Sensor was installed on the Agricultural sensor Board. Agric. Sensor Board was recalibrated to measure the temperature of drinking water at the Atmospheric (Room) Temperature. Waspmote Software was installed on a laptop. Compiler (API or SDK) –Application Programming Interface or Software Development Kit was installed in the laptop. The temperature sensor was powered up and verified that the sensor outputs real-time data. a simple C++ program was written to read real-time data. The setup was tested for five consecutive days (at 6.30 a.m.) on the wetness of leaves due to morning dews to confirm that the application reads real-time data. The setup is shown in Figure 1
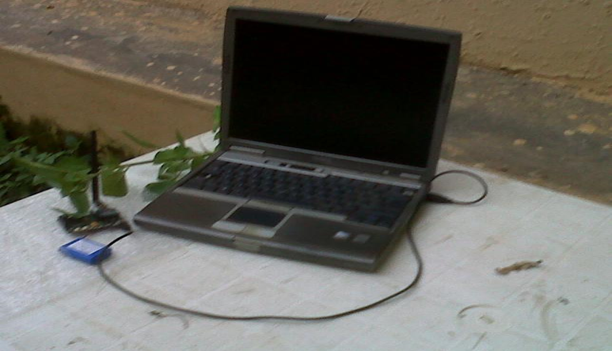
Figure 1: The measurement setup for the monitoring scheme of water quality
The agricultural sensor board with the installed temperature sensor was immersed into a container that was filled with tap water. Parameters on Waspmote Software were reconfigured until the ambient temperature was achieved and verified that the real-time temperature reading displayed on the laptop is correct. The experiment was performed at a given time of the day and 10 to 100 meters distance from the water container being monitored for the 10 days duration It will be note-worthy that the experiment considered the Time of the day when monitoring was done, Air Temperature (ATMP), Water Temperature (WTMP) and Distance between the computer and the container that has the water being monitored. The flowchart process for the monitoring scheme of water quality is shown in Figure 2. Also, the algorithm for the temperature sensor startup is shown in Figure 3.
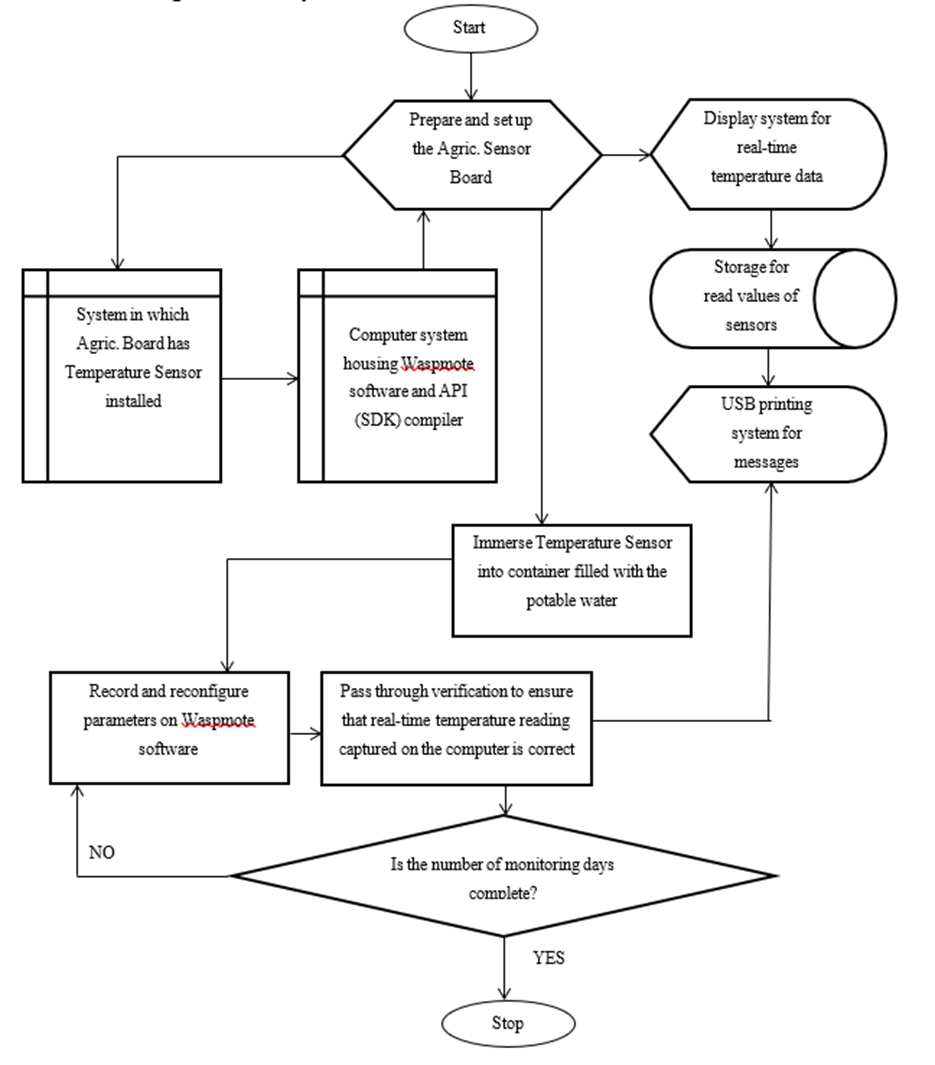
Figure 2: Flowchart for the monitoring scheme of water quality
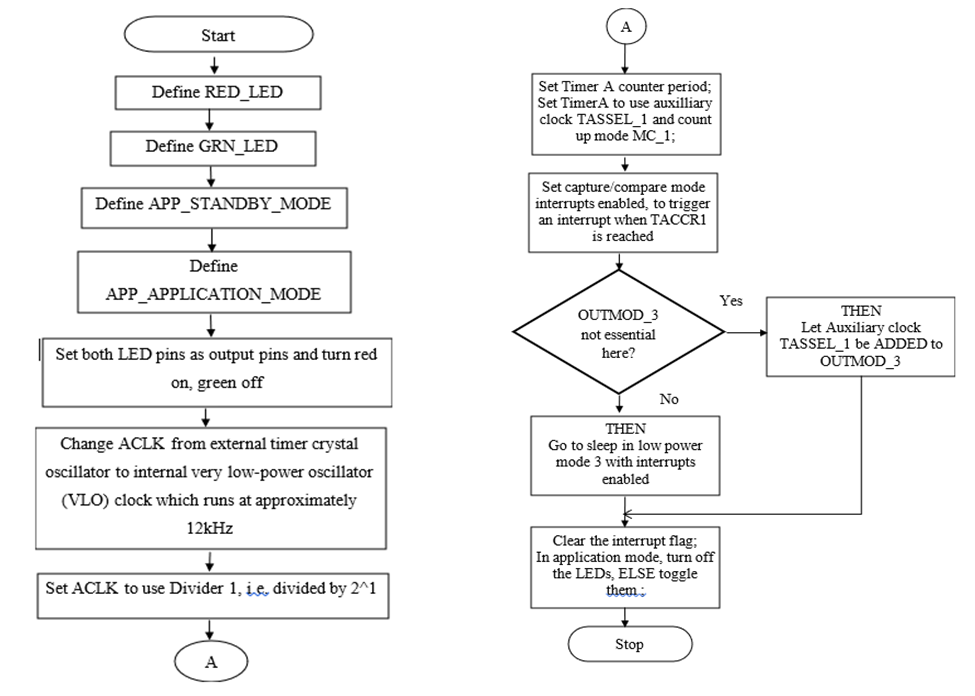
Figure 3: Temperature Sensor Startup
Results and Discussion
The result showing the cumulative analysis at a 10-100m distance and 6.30 am from the water container being monitored for the 10 days duration is shown in Table 3 and the graphical analysis is shown in Figure 4
Table 3: Cumulative data for analysis at a 10 – 100 m distance and 6.30 am
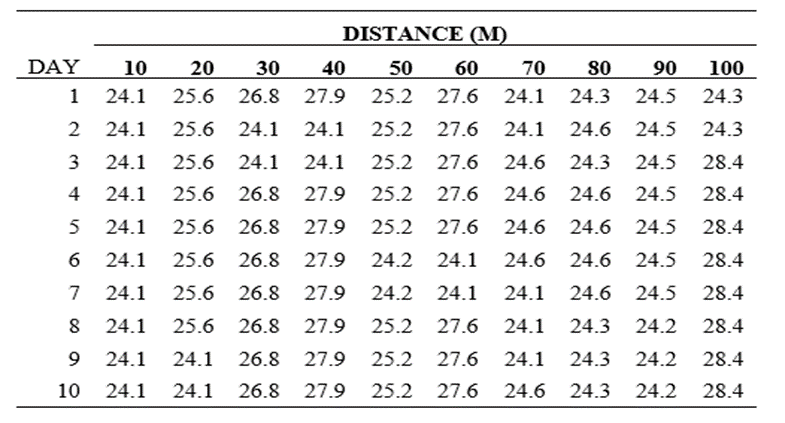
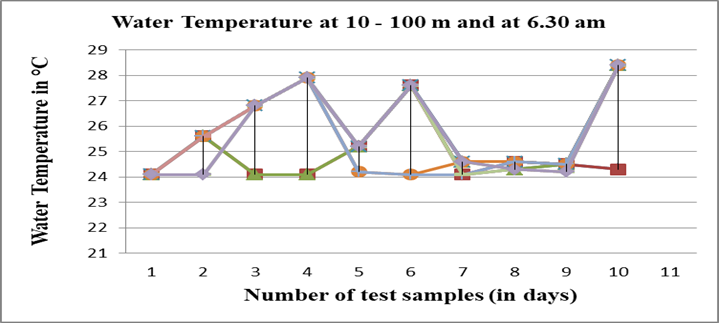
Figure 4: Cumulative graphical representation at 10 – 100 m. 1
The experiments were able to generate data for every change in the environmental conditions that affect the sampled water. Using the software, it was possible to read that the average temperature measured for the temperature of drinking water maintains 25.57ºC for the duration of the experiment. The results obtained by testing at different distances between the water source and test equipment and for a given number of days (10) showed that all slight differences were recognized or detected by the tests. As long as the water is pure, it is easy to notice that the average temperature reading is not far from the individual temperature readings in the environment. Nevertheless, theongoing discussions have been able to achieve the research objectives of Investigating the performance of Waspmote Wireless Sensors Networks (WWSN) in the monitoring of the quality of water to obtain the quality of ordinary water; developing a model for continuous monitoring of the characteristic quality of water using WWSN; detailing the different features of water at an interval of times; simulating and testing the model to obtain a continuous state of the water and comparing the various results to obtain the improved quality of water.
Conclusion
The motivation behind this study was to ensure that humans and other water-dependent processes have access to safe drinking water. The study successfully developed a wireless sensor network-based monitoring system that continuously tests the purity of potable water. The software used in the experiment showed that the average water temperature maintained a constant reading of 25.57ºC throughout the study. The system was able to detect even slight increases in water temperature resulting from changes in environmental conditions, which could indicate the presence of impurities in real-world water supply chains. If the water is pure, the average temperature reading closely resembled individual temperature readings in the environment.
Future studies will explore the measurement of other crucial indicators of water quality such as humidity, pH, and turbidity levels to ensure comprehensive and reliable monitoring of potable water.
References
Wang, H., Wang, S., Liu, S., Chen, Y. & Li, R. (2021). Research on Wireless Water Quality Monitoring Method Based on STM32. Journal of Physics: Conference Series 1750, 012024. https://doi:10.1088/1742-6596/1750/1/012024
Adu-Manu, K. S., Tapparello, C., Heinzelman, W., Apietu Katsriku, F. & Abdulai, J. (2017). Water quality monitoring using wireless sensor networks: Current trends and future research directions. ACM Trans. Sen. Network, 13, 1 (4), 41
Antoine, B. & Marco, Z. (2011). Introduction to wireless sensor networks.International Centre for theoretical physics, Trieste, Italy. https://www.academia.edu/18106521/Introduction_toWireles Sensor Networks. Accessed 10/10/2019.
Pule, M., Yahya, A. & Chuma, J. (2017). Wireless sensor networks: A survey on monitoring water quality. Journal of Applied Research and Technology 15, 562–570
Akkaya K. (2015). An Energy-Aware QoS Routing Protocol for Wireless Sensor Networks in the Proceedings of the IEEE Workshop on Mobile and Wireless Networks, Providence, Rhode Island. pp. 211-221
Forster, A. (2018). Simulation, evaluation and testing of wireless sensor networks. International Centre for theoretical physics, Trieste, Italy. Accessed 10/12/2019
Ahmed, U., Mumtaz, R., Anwar, H., Mumtaz, S. & Qamar, A. M. (2020). Water quality monitoring: from conventional to emerging technologies. Corrigendum: Water Supply, 20(1), 28–45. https://doi.org/10.2166/ws.2019.144
Tuna, G., Nefzi, B., Arkoc, O. & Potirakis, S. M. (2014). Wireless sensor network-based water quality monitoring system. Key Engineering Materials, 605, 47-50. DOI: 10.4028/www.scientific.net/KEM.605.47
Fawell, J. (2007). An FWR Guide to Drinking Water Standards and Guidelines. Foundation for Water Research, 1-55. http://www.fwr.org/waterq/frg0004.pdf